FORECASTS
All imp weather charts in one place.
bookmark this page, visit daily.
#letitstorm
meteograms for the following locations:
Gulmarg, Kashmir
Typically, 1 mm of precipitation = 1 cm of snow at 0°C (assuming normal density snow). However, colder temperatures might produce lighter, fluffier snow, increasing this ratio (e.g., 1 mm = 2-3 cm snow in very cold conditions)
Keylong, Lahaul, Himachal Pradesh
Manali, Kullu Valley, Himachal Pradesh
Uttarkashi, Garwal, Uttarakhand
Drass, Ladakh
INTERACTIVE CHARTS
Rain, thunder
Elevation
Surface
Forecast model
ECMWF
NEMS - MODEL - 12 KM resolution, 180hr forecast:
Improved NMM successor, in operation since 2013. NEMS is a multiscale model (from global down to local domains), that improves calculation of cloud and precipitation development substantially.
Typically, 1 mm of precipitation = 1 cm of snow at 0°C (assuming normal density snow). However, colder temperatures might produce lighter, fluffier snow, increasing this ratio (e.g., 1 mm = 2-3 cm snow in very cold conditions)
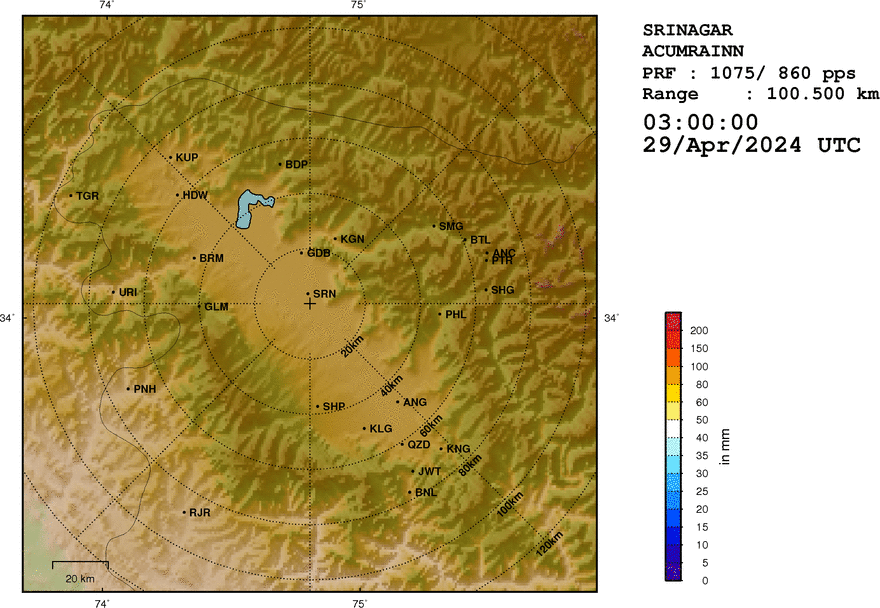
Real Time Weather Radar - SRINAGAR
What it shows? (past 3hr weather rain/snow accumulation)

Explainer:
The chart uses a topographical map with labeled locations such as SRN (Srinagar), KUP (Kupwara), and BRM (Baramulla), The concentric circles indicate distance from the radar station, with each ring marking a 20 km increment.
How to Use This Chart
- Travel Planning: If you’re heading to the mountains, check for red or yellow areas that might indicate heavy snowfall or rainfall, potentially affecting travel conditions.
- Outdoor Activities: For skiing, trekking, or mountaineering, blue or green zones indicate safer weather, while red areas suggest you should postpone plans.
- Short-Term Forecasting: This chart helps in monitoring real-time weather and identifying patterns, such as approaching storms or clear skies.
Color Scale: color bar represents precipitation intensity in mm
Blue to green indicates light precipitation, yellow to red shows moderate to heavy precipitation, and purple represents very heavy rainfall or snowfal
The colors on the map show areas experiencing precipitation and its intensity.


Give explainers also
ReplyDeleteHeyyy I feeel like it would be nice for there to be a garwhal himalayas or at least auli, section tooo
ReplyDeleteYup. I'll add the garwal charts too
DeleteFor the novices and first time readers, a quick 'how to read' will be very helpful pls.
ReplyDeleteDo you prefer how tos under every chart type or I put links to seperate articles / guides to read charts?
Deleteunder every chart
Delete